Visualizing & Collecting Growth Data
Collecting data can seem to be a daunting task and knowing what to do with it can make everything more complicated. And if you don’t know what data you’re looking at, how will you be able to visualize it? Goldstein Growth Analytics Services provides Growth Data & Visualization consulting services.
Growth Data Collection
When collecting data, it is important to be creating some sort of CRM system or database that stores your users’ data.
Examples of good data to collect are:
Where did the user come from? (traffic source)
Did they make a purchase?
Did they abandon their shopping cart?
Who are they? (name, age, gender, etc…)
Contact Information (phone number, eMail address)
With capturing the above data, as well as other data points, you can further understand who your customers are. This is good for understanding who is buying your product, creating a remarketing ad campaign, determining your Lifetime Value of a customer (LTV) or your average revenue per user (ARPU), and much more. The aforementioned learnings and metrics will help your company spend less money to acquire more customers who buy more products.
Goldstein Growth Analytics Services provides consulting services in growth data collection, metric creation/maintenance, customer analysis, ad/email/push notification campaign audience creation.
Growth Data Storage
There are many ways to store data, from more basic data analytics platforms like the free version Google Analytics to complex databases filled with billions of rows and columns. As a company, you will need to choose which is the best fit to store data. Goldstein Growth Analytics Services provides its recommendations based on each unique situation and uses an assortment of technology such as Google Analytics, Mixpanel, or Amplitude. Goldstein Growth Analytics Services provides consulting services in database creation, analytics platform integration, database audits, and more.
Growth Data Visualization
Now that you have all this user data, how are you going to use it as support for strategy adjustments or new lines of business? Visualizing the data in a concise and meaningful way that’s easy to consume is key to getting the most out of your data. There are many good tools you can use to visualize data. Depending on the situation there are a number of different tools that can be utilized to visualize your data. Some of our favorites are: Tableau, Amplitude (specializes in event tracking), Google Data Studio (more simple, but free), etc…
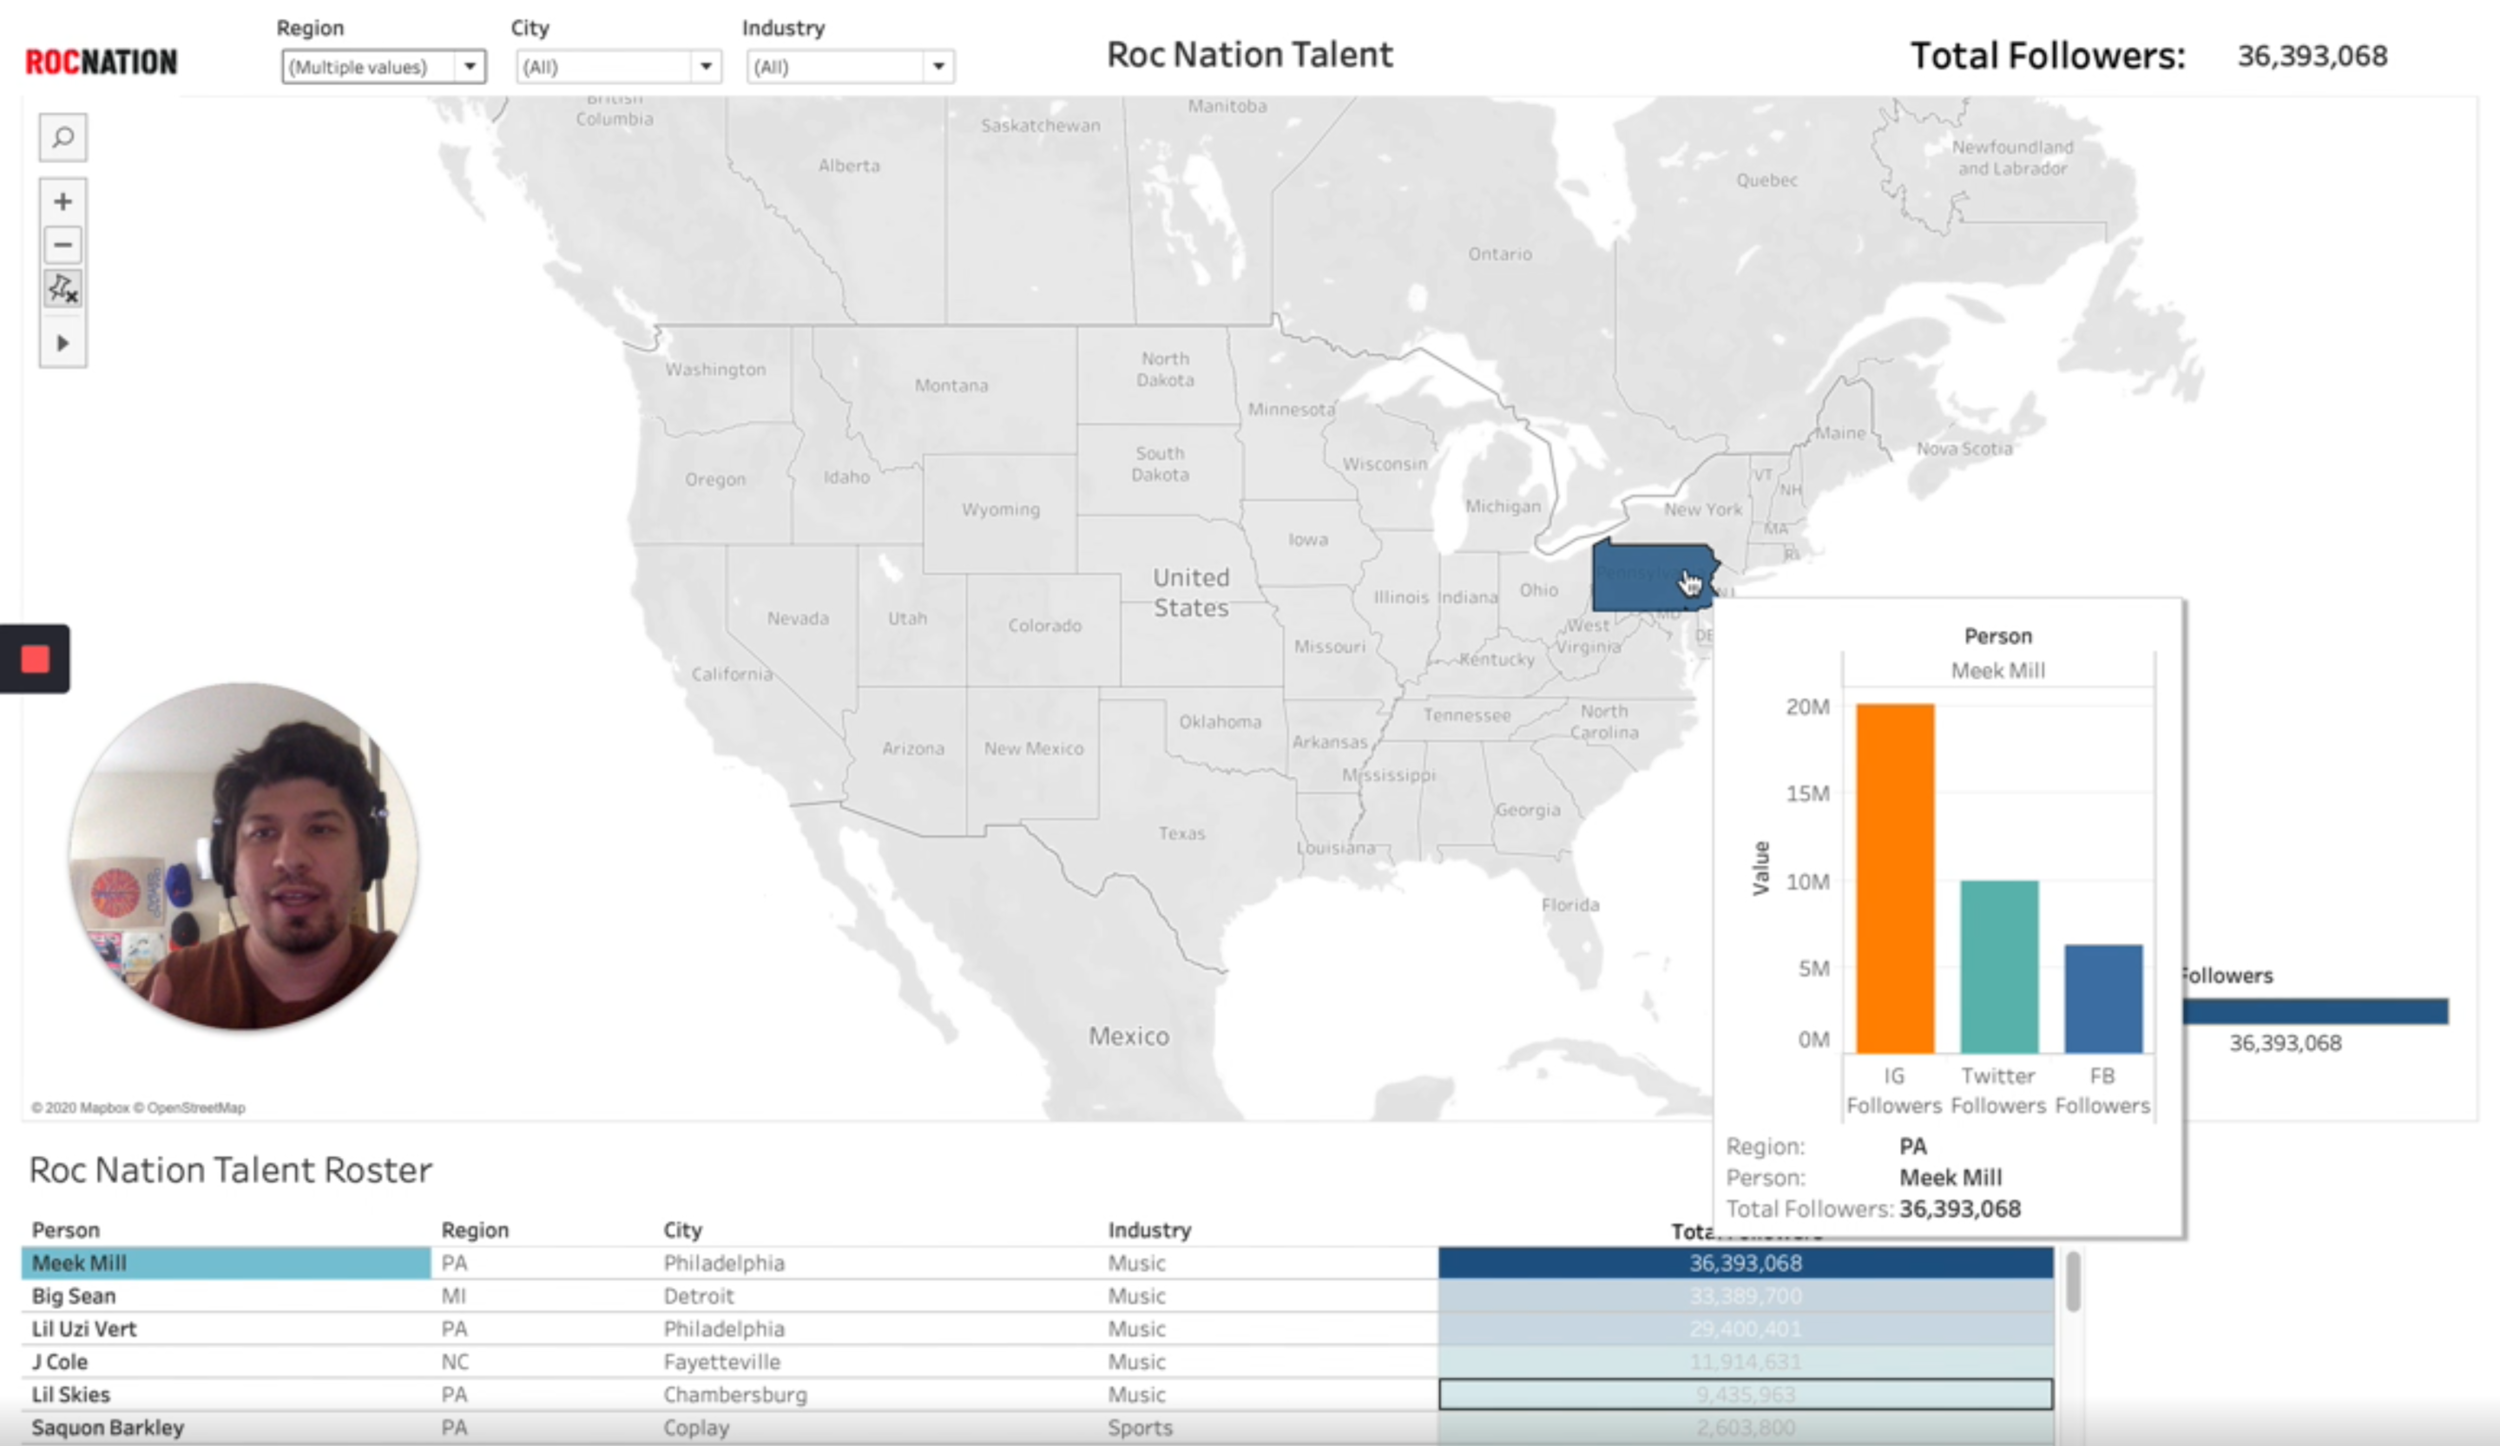
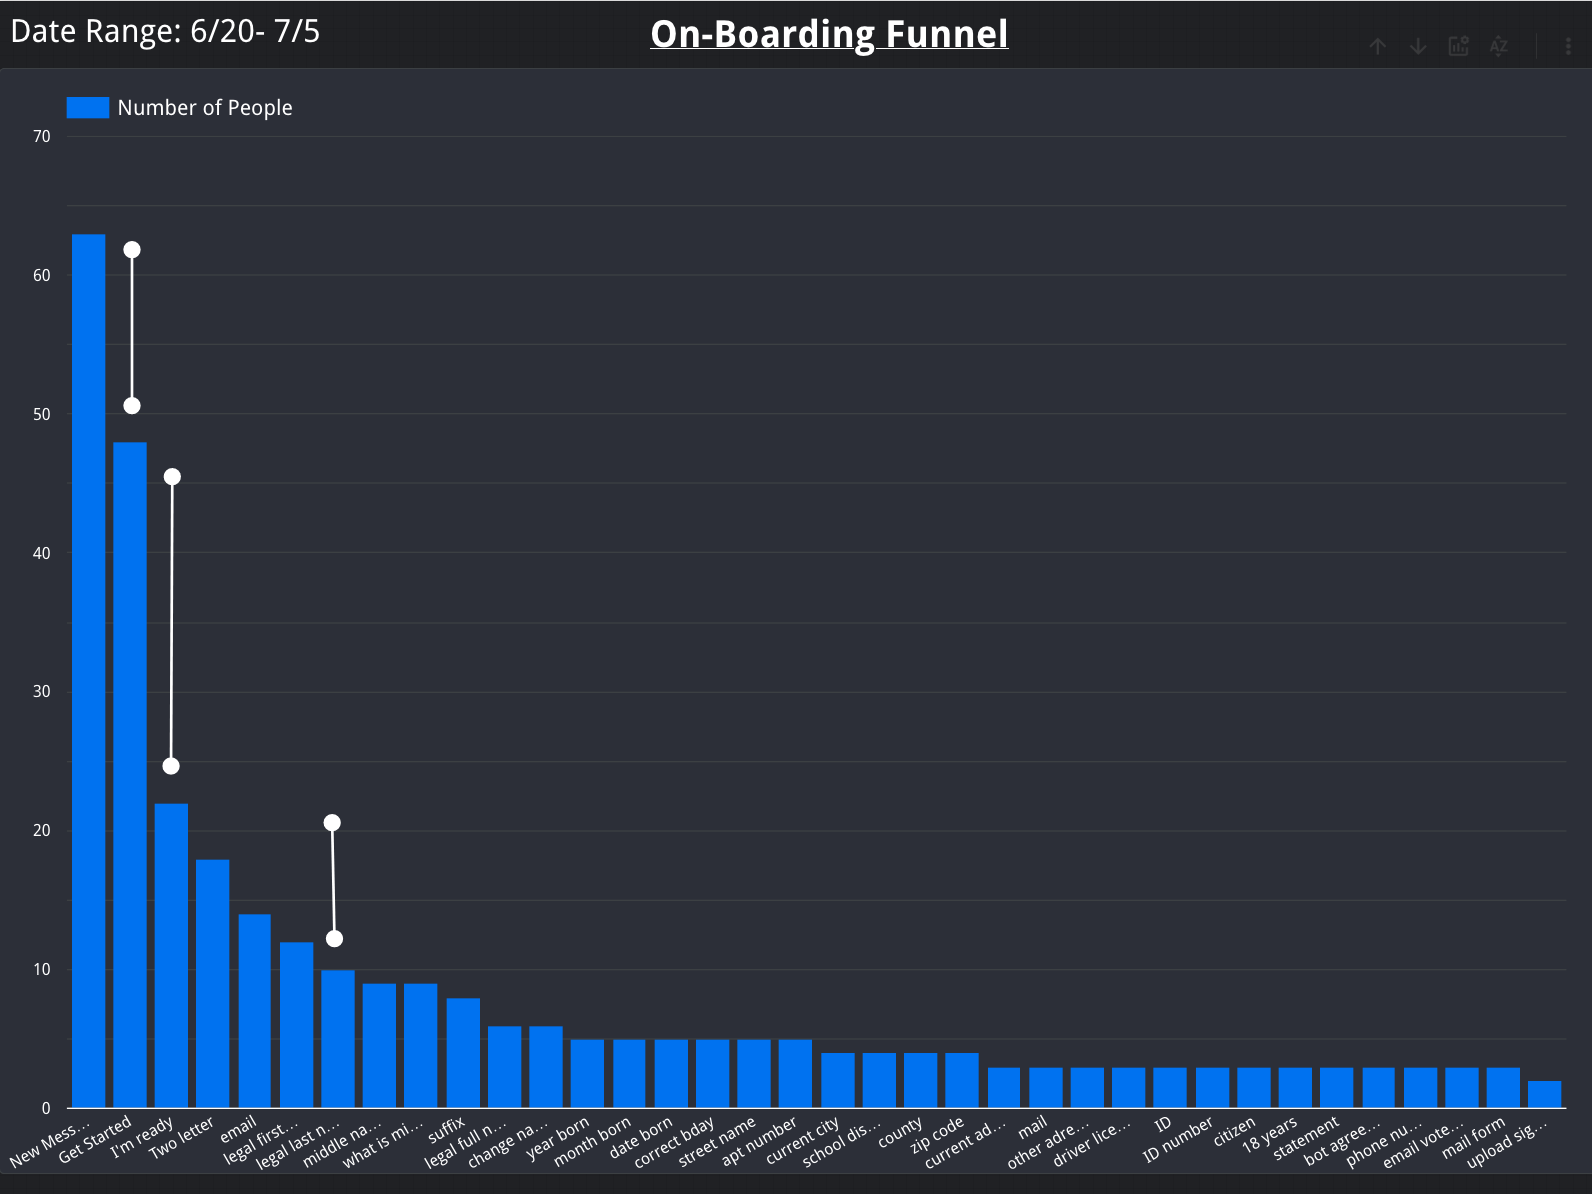
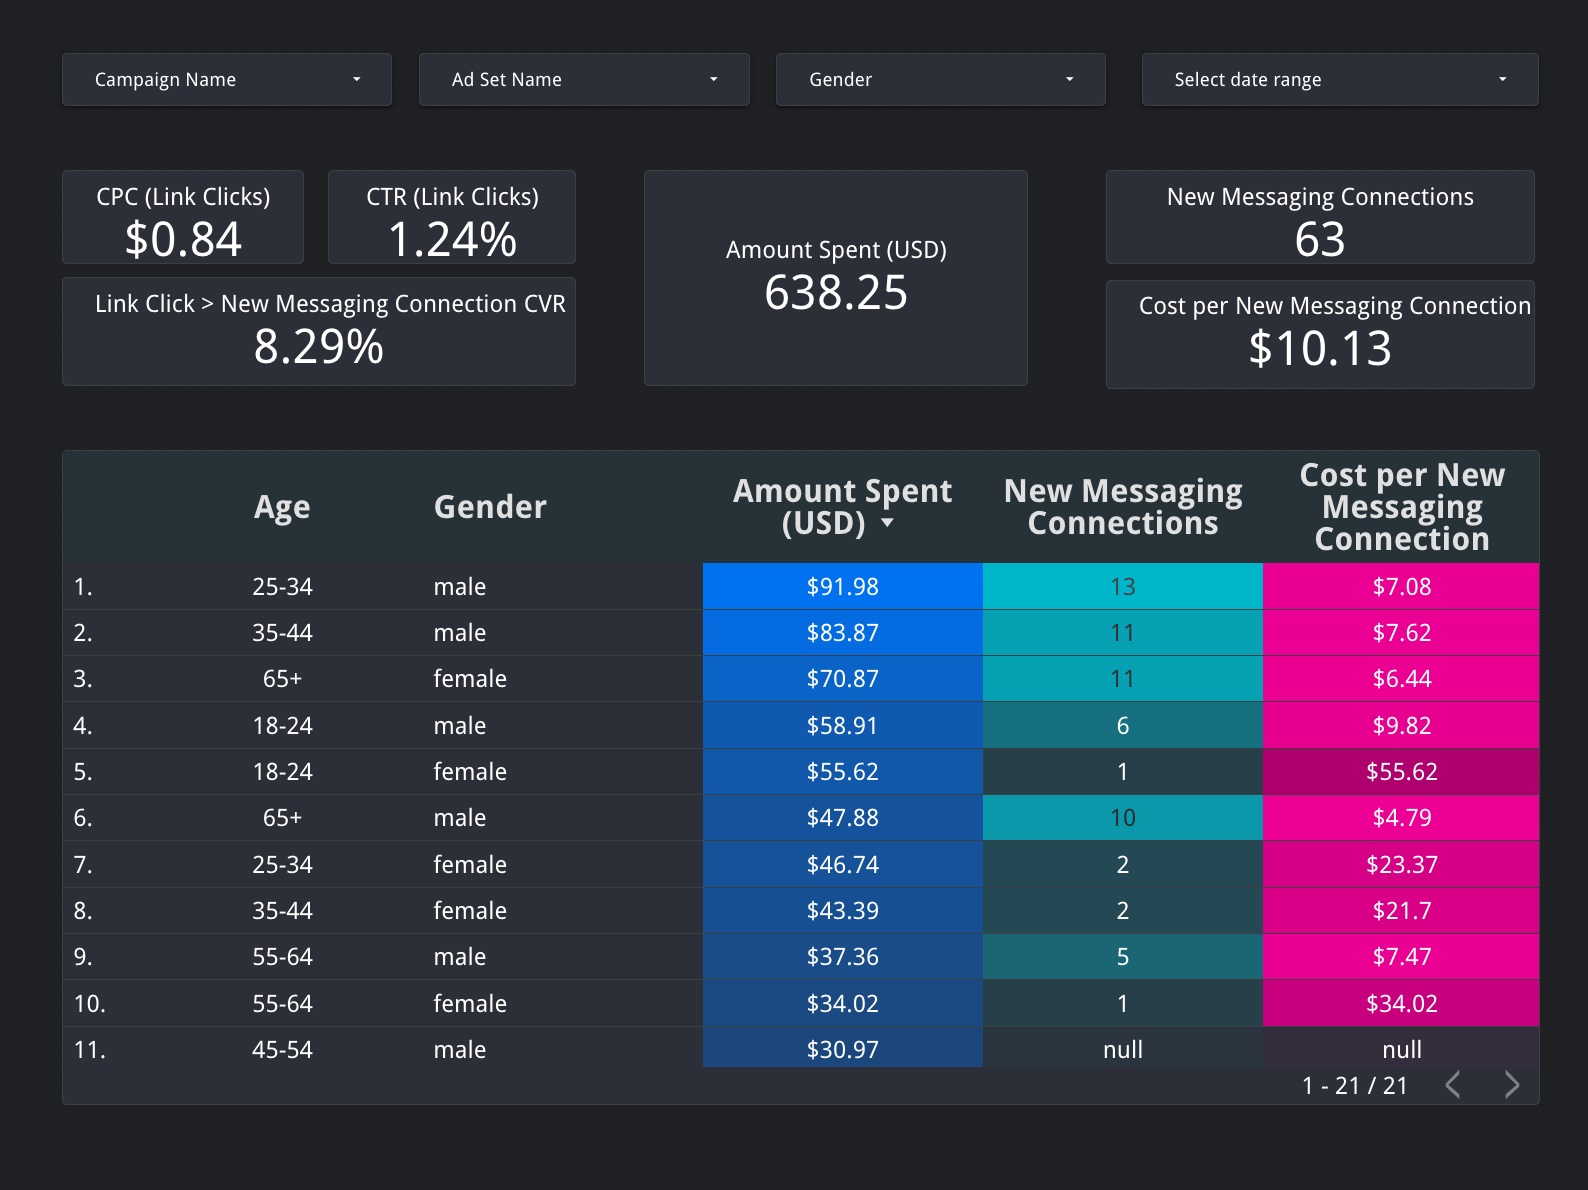
Goldstein Growth Analytics Services provides growth data visualization services like: dashboard creation for any employee level, geo mapping, ad buying/eCommerce reporting, or growth profit & loss analysis. Please see some examples below: